Global Economic Collapse.
Again.
By A. Christopher Kondaks
You’ve been scrimping and saving over a lifetime to accumulate your nest egg. But it’s at risk. Understanding the threat is the first step towards protecting your financial future. This is the secret of the Two Pies and a Squiggle. There’s no special report to order and no forking over of cash. It’s all right here on this page.
Be forewarned: reading the contents of this page will make you feel the pain. If I’m successful, the information disclosed here will make you cringe, squirm in your seat, and shake your head in disbelief and frustration.
But with that discomfort I’m hoping that you will also have a eureka experience. If I’ve done my job, you’ll get It. And if the It is experienced, you will be shaken out of complacency and inaction, compelled to implement remedial action to protect your nest egg from a financial crisis that will make 2008 look like a trip to Disneyland.
What follows is not based upon some elaborate theory nor does it require you to believe in any apocalyptic vision. It’s public information readily available on the internet and local library. Processing it, however, will require you to employ common sense and some simple mathematical calculations. It shouldn’t take more than 15-20 minutes. It’s presented in laymen’s language that is easy to understand.
Under our collective nose
As a result of the 2008-9 financial crisis, trillions were lost in equity and real estate markets. From a high of 14,164 on the Dow-Jones Industrial Average in October of 2008 to a low of 6,763 in March of 2009: a 52% decrease over a few short months. Many homes in Phoenix and Las Vegas lost as much as 80% of their value.
How much heartbreak could have been avoided if one had the foreknowledge of the impending collapse? Those few in the know liquidated positions or hedged against potential losses. Imagine how much was made shorting the S&P index when the index was at its height.
Yet only a few foresaw the coming crisis. Some publicly shared their insight and provided ample evidence, such as AIG’s overselling of Credit Default Swaps and lax regulations for issuing mortgages. The information and disclosures were there. Many snickered at doom and gloom predictions from those who warned us; few listened, perhaps blinded by irrational exuberance, bloated home values, and mushrooming stock portfolios.
Hindsight is 20/20. Today we look at those very same facts and figures and think: of course! It was so obvious! How could we have missed the signs that global economic collapse was coming.
Yet despite the warnings and public information readily available upon which one could perform the most rudimentary high school math, we missed it.
The next one
Another financial crisis is looming. As in ‘08, the signs are there. This time, however, we can choose to look, consider the ramifications, and protect ourselves.
This time, there really isn’t any excuse. In fact, all the tools necessary to crunch the numbers are available to one and all: even an 80’s-era calculator will do the trick.
We’re also fortunate for another reason: it isn’t going to be as difficult figuring this one out. The indicators are much more obvious. This time we won’t be required to wrap our minds around complicated concepts like Credit Default Swaps or Collateralized Debt Obligations in order to get it. By comparison, this one’s a no-brainer; all you’ll need is your common sense…and experience in balancing a household budget. The only difficulty will be that we have to deal with really big numbers. But I’ll simplify that for you.
Here then is the story of the two pies and a squiggle.
The math
Okay. Let’s roll up our sleeves.
We’re going to look at the federal budget of the United States. I know: nothing is more boring and sleep-inducing. But it’s absolutely necessary. There is a pay-off, so please stick with it.
Let’s take a look at some facts and figures, and then we’ll extrapolate from them.
Employing 2016 figures
Throughout this presentation, we’re going to employ 2016 figures instead of later ones. We’ll do this because this is the year in which it a certain figure of $20 trillion was projected. This is an “even” figure and although rounded off a wee bit, it makes for an excellent baseline reference, as well as for more convenient calculations. Keep in mind that the problem has actually become worse…much worse.
Fact #1 – According to budget projections, total spending by the U.S. federal government for 2016 was projected to be $3.999 trillion. Let’s call it $4 trillion. The budget comprises total expenditures and total receipts by the federal government.
FACT #2 – The federal government’s deficit for 2016 was projected to be $587 billion.
When receipts exceed expenditures, there is a surplus. When expenditures exceed receipts, there is a deficit.
Expenditures are items such as Medicaid, the military, education, Social Security benefits. Receipts are items such as personal income taxes, corporate income taxes, and Social Security contributions.
FACT #3 – The national debt by December 2016 was projected to be about $19.9 trillion. Let’s call it $20 trillion. This debt is the accumulation of every year’s deficit since 1776 less all accumulated surpluses.
FACT #4 – Each year, the federal government services this debt ($20 trillion in 2016) by paying interest on it. The interest payment on the National Debt in 2016 was projected to be $283 billion, about 7% of all expenditures (i.e., the $4 trillion federal budget). Note that this is only interest being paid on the debt; it is not a reduction of the principal.
How interest is paid
The government pays interest (#4) on the debt (#3). This is interest on financial instruments such as Treasury Bills the government has sold to investors (e.g., you and me; institutional investors such as pension funds; other countries such as the People’s Republic of China; federal government institutions). On average, these debt instruments currently pay about 1.4% interest. If you multiply $20 trillion by 0.014 you come up with an approximation of the $283 billion in interest expense the federal government was projected to incur in 2016.
The first pie
Now we’re going to look at the first pie of the Two Pies and a Squiggle.
How the “interest expense” pie slice looks now
As discussed, interest on the debt is one of many expenditures the government makes in a given year. Here’s how that $283 billion interest expense from the 2016 budget is depicted as a slice of the total spending pie:
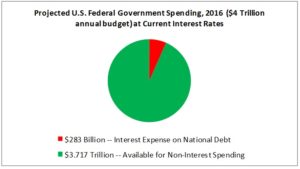
So, our first pie is the diagram above. The first pie depicts the slice of federal spending devoted to servicing the national debt during a period of historically low interest rates, such as we are experiencing today. Note it is a relatively small slice of the pie.
Do not proceed until you understand and accept the reality of low current interest rates and the relatively small percentage of total federal government spending devoted to paying interest on the national debt. This is the first pie.
The squiggle
Before we get to the second pie, we are first going to cover the squiggle…and here’s where it gets interesting:
Interest rates fluctuate
Of course interest rates fluctuate…they’ve been doing so for as long as the concept has been in existence.
Interest rates go up; and then they go down. And then they go up again…then down. And then the process repeats, over time.
The Federal Reserve sets interest rates. It isn’t necessary to go into the in’s and out’s of this institution. As important as it may be why the Federal Reserve determines the setting of interest rates, it is not important for our considerations. What is important is one of the influences upon interest rates: the market force of supply and demand, which can determine rate fluctuations. Another influence upon interest rates is inflation: raising rates is generally considered a buffer against inflation. Many of us can remember when interest rates almost reached 20% back in the early ’80s in an attempt to curb inflation.
That interest rates fluctuate is the single most important concept of this exercise. The following graph illustrates the phenomenon of fluctuating interest rates over the last 60 years:
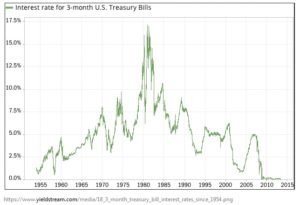
Note that these are rates for three-month U.S. Treasury Bills, one of the financial instruments used by the federal government to fund the National Debt. More importantly, note also that we are currently experiencing historically low interest rates, which means that interest rates have only one direction in which to go: UP.
That interest rates are currently at historically low levels and have only one direction to go — up — is crucial.
Do not proceed until you understand and accept the reality of fluctuating interest rates and that we are at a point in time of historically low interest rates. This is the squiggle.
The second pie
Really, REALLY big numbers
I’m about to use really, really big numbers again…but this time I’m going to ask you to perform calculations on them. There’s no getting around it; we have to deal with huge numbers, such as “billions” and “trillions”. But it won’t be too difficult; certainly no more than what is expected from a high school math student.
If you’re foggy about what a billion means or, more importantly, a trillion and how these numbers relate to, say, a million, the links provided will help you get a grasp. Here’s a really great video that will give you an idea of scope (it’s less than 2 minutes long).
The implications
Why is the consideration of interest rates, their fluctuating nature, and the fact that interest rates are at historical lows so important?
I’ll answer the question by posing another:
What will happen to interest rates if China and other purchasers of American debt stop buying? What would we have to do in order to attract them back as buyers? Would we have to put rates up or down?
Up, of course; the more interest that is offered to a potential buyer, the more attractive the debt instrument becomes. That’s an obvious response to the market force of supply and demand. However, if that’s the case, we must ask ourselves: If interest rates on Treasury Bills rise, what will be the annual interest payment on today’s $20 trillion debt?
Look out! The really big numbers with lots and lots of zeros and commas in them are coming. If you’re using a calculator, you don’t have to enter those 12 “0’s” when keying in a trillion; you can leave them out. Just remember that the resulting figure represents a trillion.
Treasuries at 12% Paying Today’s Debt
But interest rates can easily go up to 10% or 12%…after all, if you’re over 35, you’ve seen much higher rates within your lifetime; as the graph of historical rates, above, tells us, rates reached almost 20% in the early ‘80s. What would be the annual interest expense on the current debt level if Treasuries paid 12% a year in interest?
Here’s the math:
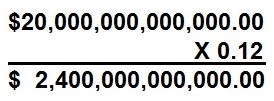
Or, in other words:
$20 trillion X 12% = $2.4 trillion
That’s $2.4 trillion in annual interest payments on just current debt levels.
Note that the above figures just service the debt; they don’t reduce the principal of the debt.
Percentage of 2016 budget
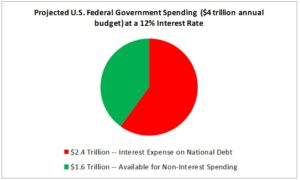
The annual budget of the U.S. government for 2016 was $4 trillion. Thus, $2.4 trillion represents over half of all current federal spending. In the first pie, we saw the relatively small “slice” of current debt servicing super-imposed upon the entire pie of federal spending. Now we’re going to superimpose that $2.4 trillion onto our federal budget pie chart. This will be our second pie.
What the “interest expense” pie slice may soon look like
Here’s what that slice may look like once more than 50 cents of every dollar is spent just to service the debt:
The problem: funding non-interest spending
Compare the first pie with the second pie.
In the first pie, there’s $3.717 trillion available for non-interest spending for items such as Social Security, Medicaid, and food stamps; in the second pie, only $1.6 trillion.
That’s a difference of $2.117 trillion. In other words, under a scenario of 12% interest rates, $2.117 trillion that used to be available to spend on non-interest federal government programs must now be spent on interest payments. It is no longer available.
If over half of all federal government spending is going to go just to service the debt where will the funding come to provide services such as Medicare and Medicaid? The military? Education? Social Security?
Is it too far-fetched to imagine a scenario in which more than 50 cents on every dollar spent by the federal government will go just to service the debt?
What is not a stretch is to describe such an outcome as a form of indebted servitude….a form of financial slavery to our creditors that would continue for decades.
Entitlement programs
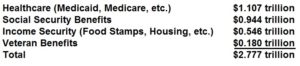
Over 2/3rds of the federal government budget goes towards entitlement programs. Here’s a summary of the major entitlement program spending for 2016:
According to the Washington Post, “In 2011, about 49 percent of the population lived in a household where at least one member received a direct benefit from the federal government.” The breakdown by program can be viewed in the following chart:
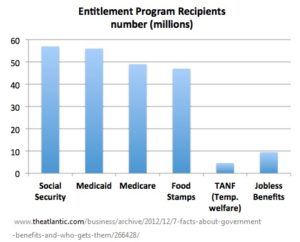
Approximately 151 million Americans receive benefits from one or more government
programs (note that there may be some overlapping of recipients as indicated in the above chart).
What has this got to do with our consideration of the two pies and a squiggle? Tens of millions of Americans are dependent upon these programs in order to receive basic necessities of life: food, shelter, medical care, sustenance income, etc. Without these programs – or a considerable reduction in the amount they receive – a real threat to their ability to survive would exist.
The trillions of dollars that the federal government currently provides to 151 million Americans is a significant chunk of our annual $18.5 trillion national economy. Any disruption to the flow of these funds – or their purchasing power – would deliver an economic and social blow the likes of which we haven’t seen.
It is not for me to outline scenarios of doom and gloom that a loss of trillions of dollars in sustenance payments to millions of Americans would create. I leave that up to your imagination.
A 5% scenario
Even though the 12% scenario outlined above is entirely possible – and we’ve seen rates go as high as 17% in the early ‘80s – you may think that this is too high a forecast. After all, if we look at our squiggle, interest rates were only above 10% for a relatively brief period: about 3 or 4 years between 1979 and 1985.
What about 5%? Is that more a more reasonable figure?
Let’s project a 5% scenario. From the squiggle illustration, we can see that since 1955, rates have been below 5% about half the time; the rest of the time rates have been above 5%.
Here’s the math:
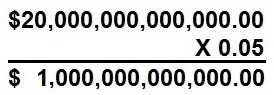
Here’s the same calculation without the zeros and commas:
$20 trillion X 5% = $1 trillion.
At 5%, that’s still a $1 trillion a year interest payment…which reduces funds available for non-interest programs by about $700 billion over what we are spending on them today.
Keeping interest rates low
As long as interest rates remain low, we can service the national debt until the cows come home. At 1.4% interest, we can easily service a $20 trillion debt because, as we’ve seen, such interest payments only represent about 7% or 8% of the federal government’s annual budget. Indeed, a doubling of the debt to, say, $40 trillion would only mean that about 15% of the annual budget went towards servicing the debt, something that would be relatively easy to manage.
Therefore, the danger is not the amount of the debt; it is whether interest rates rise. And when interest rates rise, we can now see that it will be virtually impossible to fund programs that provide essential sustenance to tens of millions of Americans.
Cut? Or increase taxes?
Two obvious solutions are: cut entitlement programs or increase taxes.
Let’s deal with each.
Cuts: from where?
As we’ve seen, even an increase to a modest 5% interest rate would mean about $700 billion that would have to come from other budget expenditures in order to pay this additional interest. Where will the cuts come from? Social Security? Medicare? Medicaid? Food Stamps? And cuts would have to be significant, leading to dire consequences to the recipients…and it is not a stretch to suggest that such cuts will be life threatening to millions if not tens of millions of Americans.
But the cuts will have to be made.
Tax increases
Or, alternatively, instead of cuts, why not increase taxes? Wouldn’t that make up the deficit? There are several potential sources for increases: personal income taxes, Social Security contributions, corporate taxes, and implementation of a national sales tax.
The Laffer Curve tells us “that the more an activity such as production is taxed, the less of it is generated; likewise, the less an activity is taxed, the more of it is generated.” There is only so much blood you can get from a stone. With corporate tax rates near the highest in the world and what some would suggest is optimal personal income tax rates, there is not many avenues left to bleed the American taxpayers for more revenue. Indeed, an increase from any new tax scheme would be small relative to the amount that would be needed to make up the amount lost to the increase in interest expense spending.
Bottom line: the entitlement programs that 10s of millions of Americans have come to rely upon and which have become such an integral part of our economy will all be at risk. There simply won’t be enough tax receipts to fund them if an additional $700 billion – or more! — will be going towards servicing the debt.
Do not proceed until you understand and accept the premise that with higher interest rates comes a larger percentage of federal spending devoted to servicing interest on the national debt. This will be a huge slice of the pie. As a result, funding for entitlement programs will be at risk. This is the second pie.
An alternative to cutting and taxing
There is, however, an easier fix…one that can be implemented which can solve the problem virtually overnight.
We can inflate our way out of the problem. That is, print more money. Printing more money will provide the government will the ability to pay not only the interest payments but the principal as well.

The easy fix
If there’s one thing we know it’s this: politicians act for short-term gain and political expediency. They’ll always look for the easy fix. When Medicare, Medicaid, Social Security, etc. are all desperately short of funding the easy fix will be to print more money. Churn out more Benjie’s…and Hamilton’s…and Jackson’s…
Indeed, some feel that we are already over-printing money.
Over-printing money, however, leads to inflation. But this time out it won’t be the meek garden variety inflation we experienced in the ‘70s and ‘80s in which “only” double digit inflation of 10% or 12% was visited upon us.
This time we are dealing in the trillions. Many trillions.
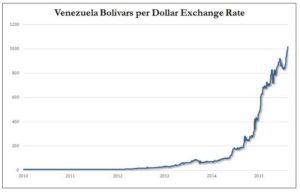
Perhaps it is a stretch to suggest that the United States will experience what Zimbabwe did with runaway inflation. After all, Zimbabwe is an example of a Third World country with few natural resources or a strong economic foundation upon which to rely. But perhaps not.

However, we’ve even seen natural resource rich nations succumb to hyperinflation as well. Venezuela — with the largest proven oil reserves in the world – being the prime example. And we should note that Venezuela has its share of entitlement programs, just like the United States.
A self-induced government-created hyper-inflation is the easy fix.
Make no mistake about it: hyper-inflation will solve the problem. The twenty or so trillion dollars of debt can be paid off with worthless American dollars relatively quickly.

The downside of the hyperinflation solution
In the process, however, tens of millions of Americans will become impoverished. Those on fixed incomes — such as Social Security or pension plans — will see their purchasing power dramatically reduced. The value of the dollar will decline making the purchasing of foreign goods out of reach. Individual portfolios top-heavy with fixed investment instruments such as bonds, CDs, savings, and money market accounts will decline in value relative to the Consumer Price Index.
On the world stage and in global markets, the reputation of America will be irrevocably and permanently diminished.
Protect yourself: hedge against inflation
Combatting hyperinflation demands a hyperhedge. A hedge would counteract or nullify the effects of inflation and maintain the buying power of one’s assets. This would be particularly true for those with a disproportionate percentage of fixed assets in their portfolio as these are most vulnerable to the negative effects of inflation.
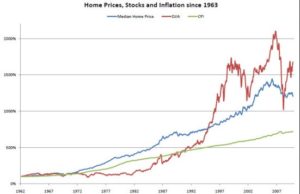
Implementing a hedge would necessarily require one to reposition one’s assets: divesting from fixed and other exposed assets and investing in areas traditionally immune to the effects of inflation. For example, an increase in the price of real estate and stocks have demonstrated a correlation to an increase in the Consumer Price Index:
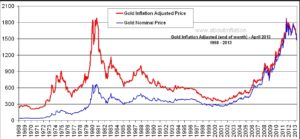
Another traditional hedge against inflation is precious metals:

Your Hyperhedge™ Quotient
What are the traditional and proven methods to counteract inflation? Are they different for hyperinflation? Which category of asset(s) are best: real estate? Stocks? Gold? Art work?
No one should put all their eggs in one basket. What is the proper “mix” of assets and proper balance to counteract hyperinflation?
What percentage of one’s income should be devoted to countering inflation? What percentage of net worth?
Should one take advantage of reverse mortgages to buy more real estate?
Should the purchase of precious metals be for bullion? Options? Future contracts?
Should the repositioning of assets to more inflation-immune assets be made within one’s IRA or 401(k)? Or with after-tax dollars?
Answering these questions establishes your hyperhedge quotient. Trained financial professionals can assess your individual circumstances, needs, and net worth in order to determine the quantity and procedure of integrating the hyperhedge into your financial portfolio. Professionals in the Two Pies and a Squiggle network are such individuals.
The first step is to request that a professional contact you in order to answer these questions. Please take advantage of this opportunity!

TwoPiesAndaSquiggle.com and its agents do not act as (a) personal investment advisor(s) for any specific individual. We do not advocate for the purchase or sale of any security or investment and the proprietary presentation and analysis presented on this website is not intended as either advice or recommendations to prospective investors. Investment markets have inherent risks and there can be no guarantee of future profits. Warning: The past performance of any trade whether actual or hypothetical is not necessarily an indication of future results. All types of investments – including but not limited to currencies, commodities, stocks, futures, options and all types of investment trading -- can have large potential rewards, but also carry large potential risks. We make absolutely no representation that gains or losses are likely or achievable and serve only as a conduit for interested parties to communicate with financial professionals and should be aware of the risks and be willing to accept them in order to invest, should never trade with money that one cannot afford to lose, and one must accept that there will be losses, and one must be able to sustain such losses, both from a financial as well as an emotional point of view.